Longitudinal A Height Change (2000-2019)


This graph shows the year-to-year and cumulative surface elevation change along the longitudinal centerline of the Taku / Matthes / Llewellyn glacier system. GPS surveys at this profile (Longitudinal A) began in 1999 and continue to the present. Measurements are taken at 500-meter intervals beginning 13.5 kilometers upglacier from Taku Point (on the south side of the Taku River) and continue 60 kilometers up the Taku and Matthes Glaciers, over the Matthes/Llewellyn divide (southern source of the Yukon River), and down the Llewellyn Glacier. The vertical cross-section of this profile is shown by the bold white line in the graph and is referenced to the right-hand Y-axis.

The animated plots show the magnitude of year-to-year and cumulative surface elevation change, as measured during July and early August every year. These plots are referenced to the left-hand Y-axis and show the spatial variation of surface elevation change. For example, the 2000 to 2001 plot reveals that, compared to 2000, the glacier in 2001 thickened more at the lower elevations than it did at the higher elevations. It also shows that the thickness remained essentially unchanged at the Matthes/Llewellyn divide, and that the Llewellyn Glacier thinned.

The cumulative effect of the individual year-to-year height change is shown by the final bold white plot, labeled 2000 to 2019. This clearly indicates that the Taku and middle Matthes glaciers have thinned by about 9-10 meters. However, at an inflection point at approximately 52

 
kilometers upglacier from Taku Point, the magnitude of thinning increases, ultimately resulting in 25 meters of thinning on the Llewellyn Glacier since 2000. Note that the magnitude of thinning of the Llewellyn Glacier down-glacier from our last survey point is greater than 25 meters, however we have not surveyed the lower sections of the Llewellyn Glacier, so we cannot provide a precise value.

It is interesting to note that the pattern of surface elevation change varies from year-to-year. Some years, the lower elevations of the Taku Glacier experience greater thickening than the higher elevations. In other years, the greatest thickening occurs at the higher elevations. While in still other years, the trend is thinning along the entire extent of the profile. Of particular note is the significantly positive change from summer 2011 to summer 2012. This was a result of higher than normal snowfall during the winter combined with an unusually cool and cloudy spring and early summer.

These changes are a result of the weather on the Juneau Icefield throughout the year. Temperature and precipitation are critically important in determining the magnitude of yearly thickening and thinning at the various elevations of the glacier system.

Download the GPS survey data ( Excel format)
Download a larger version of the above video
Download a static version of the graph


Longitudinal A Annual Height Change (2000-2019) 

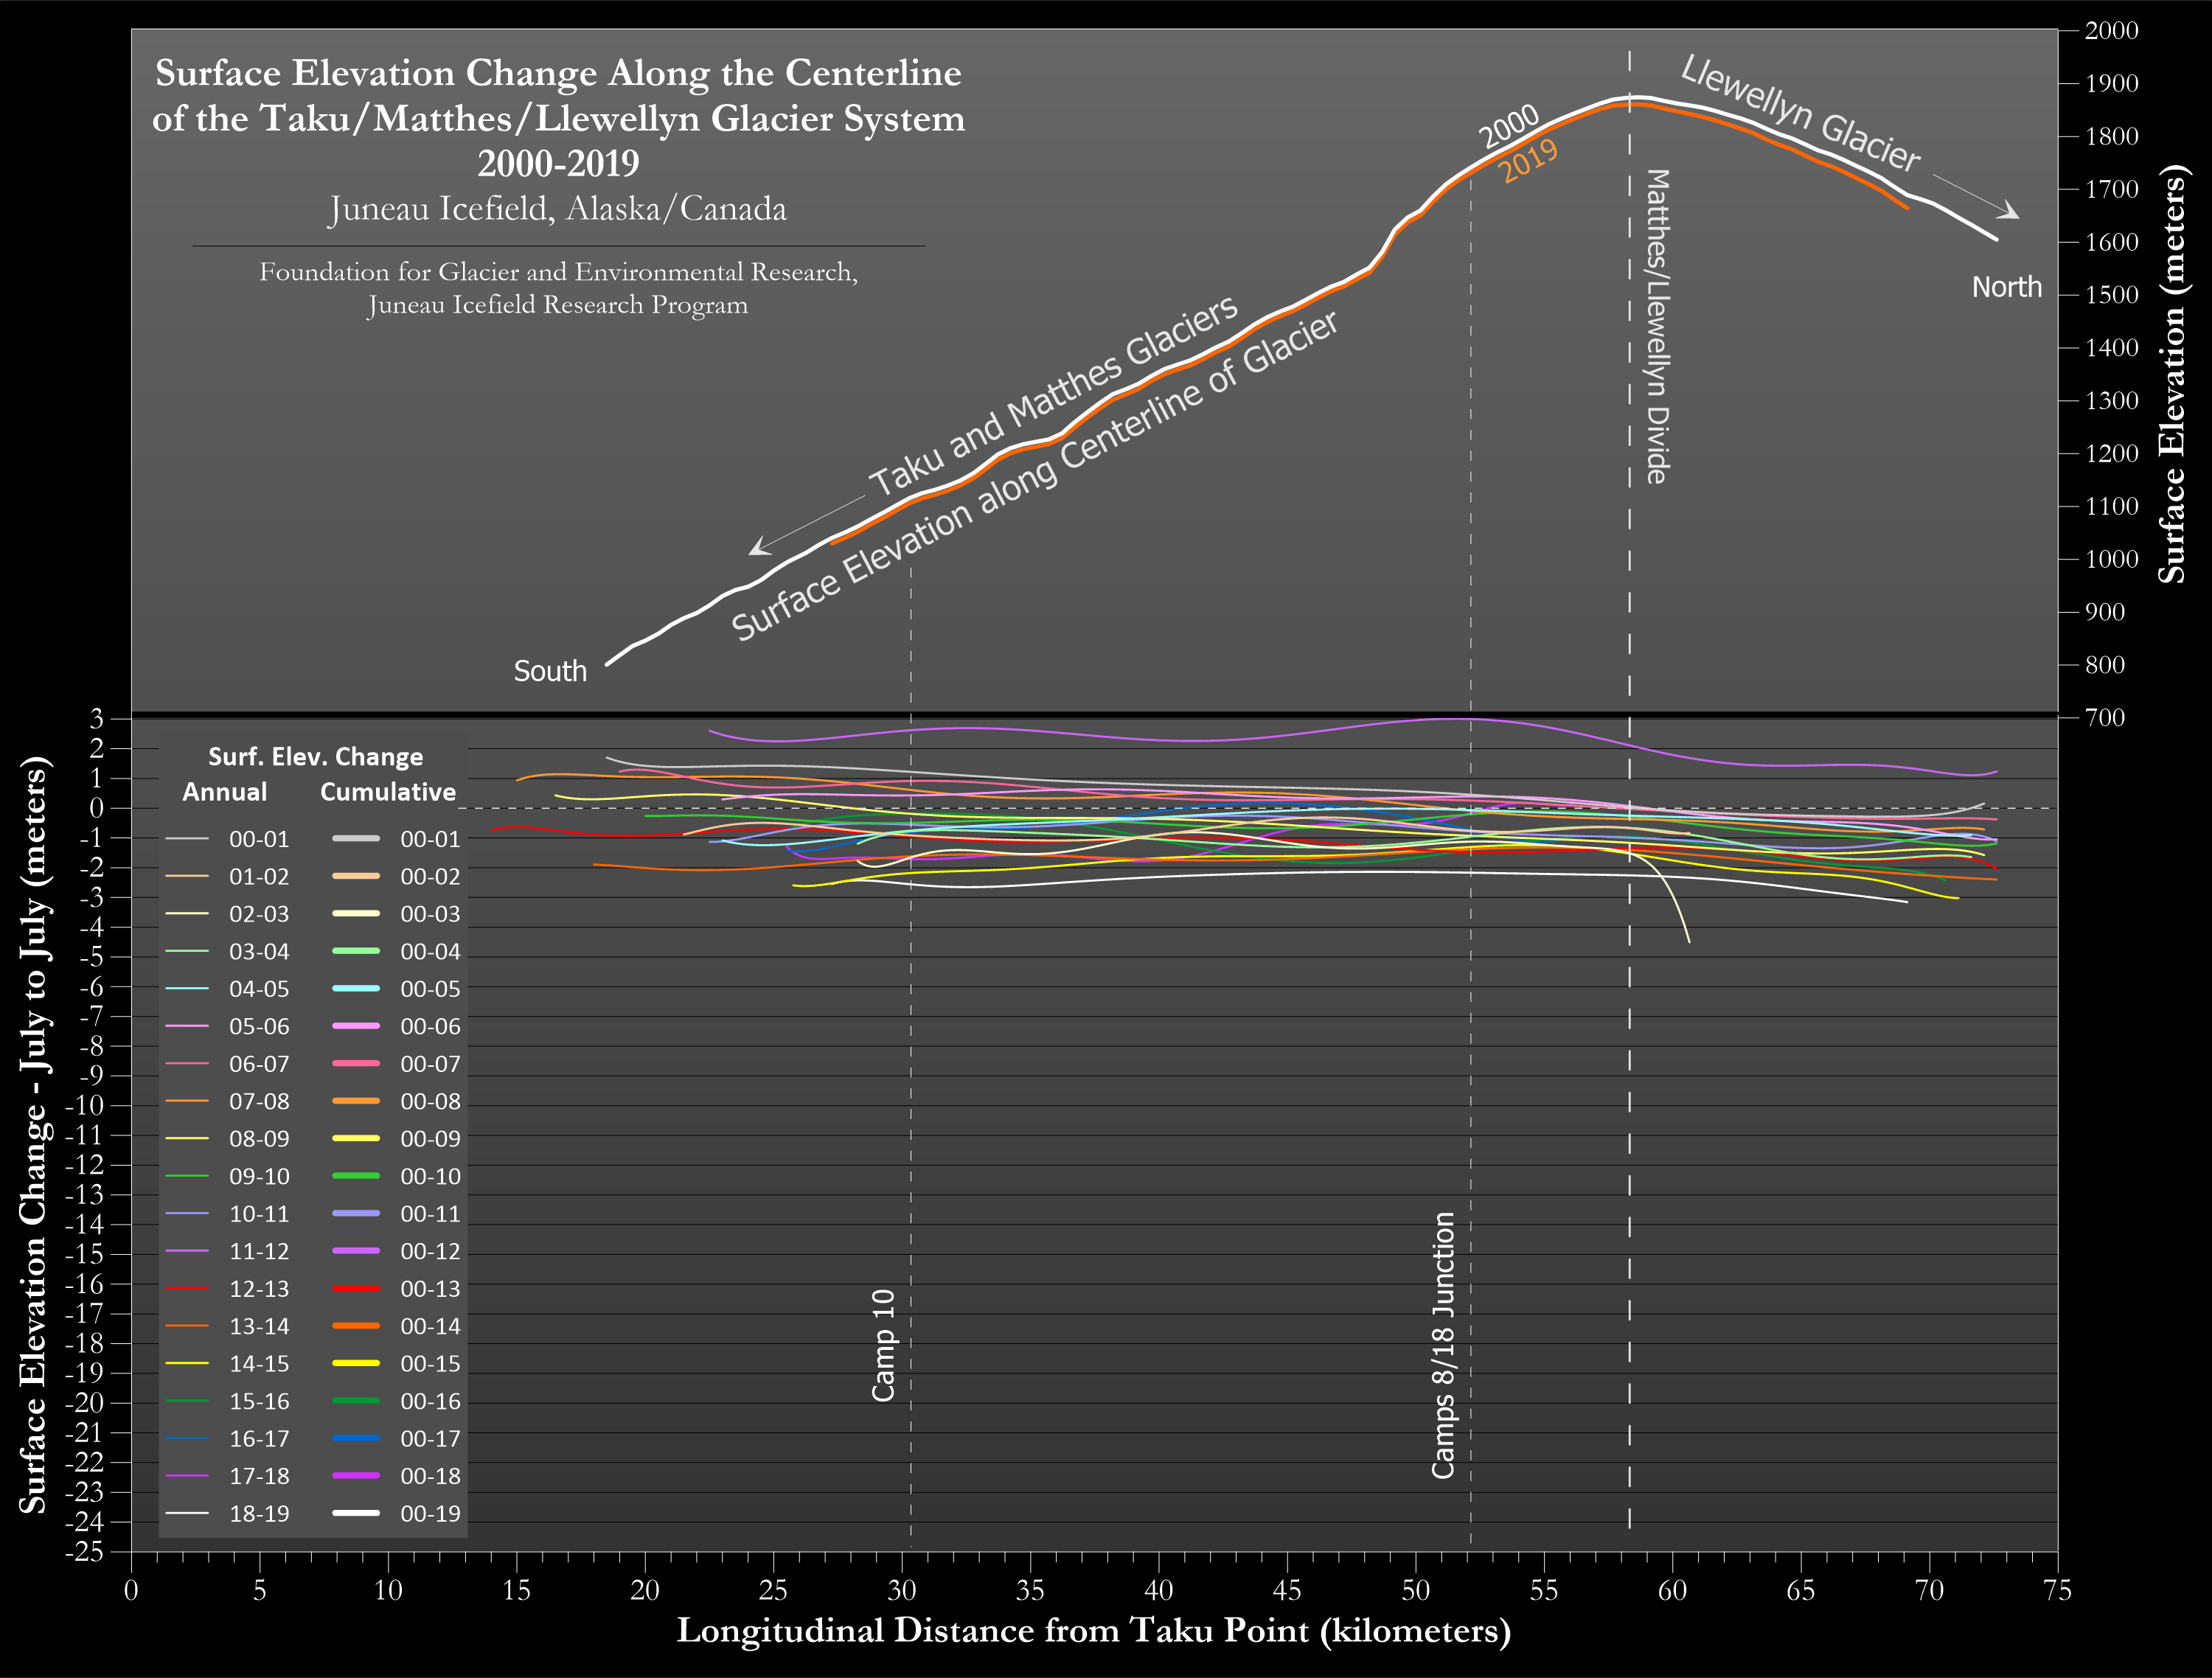
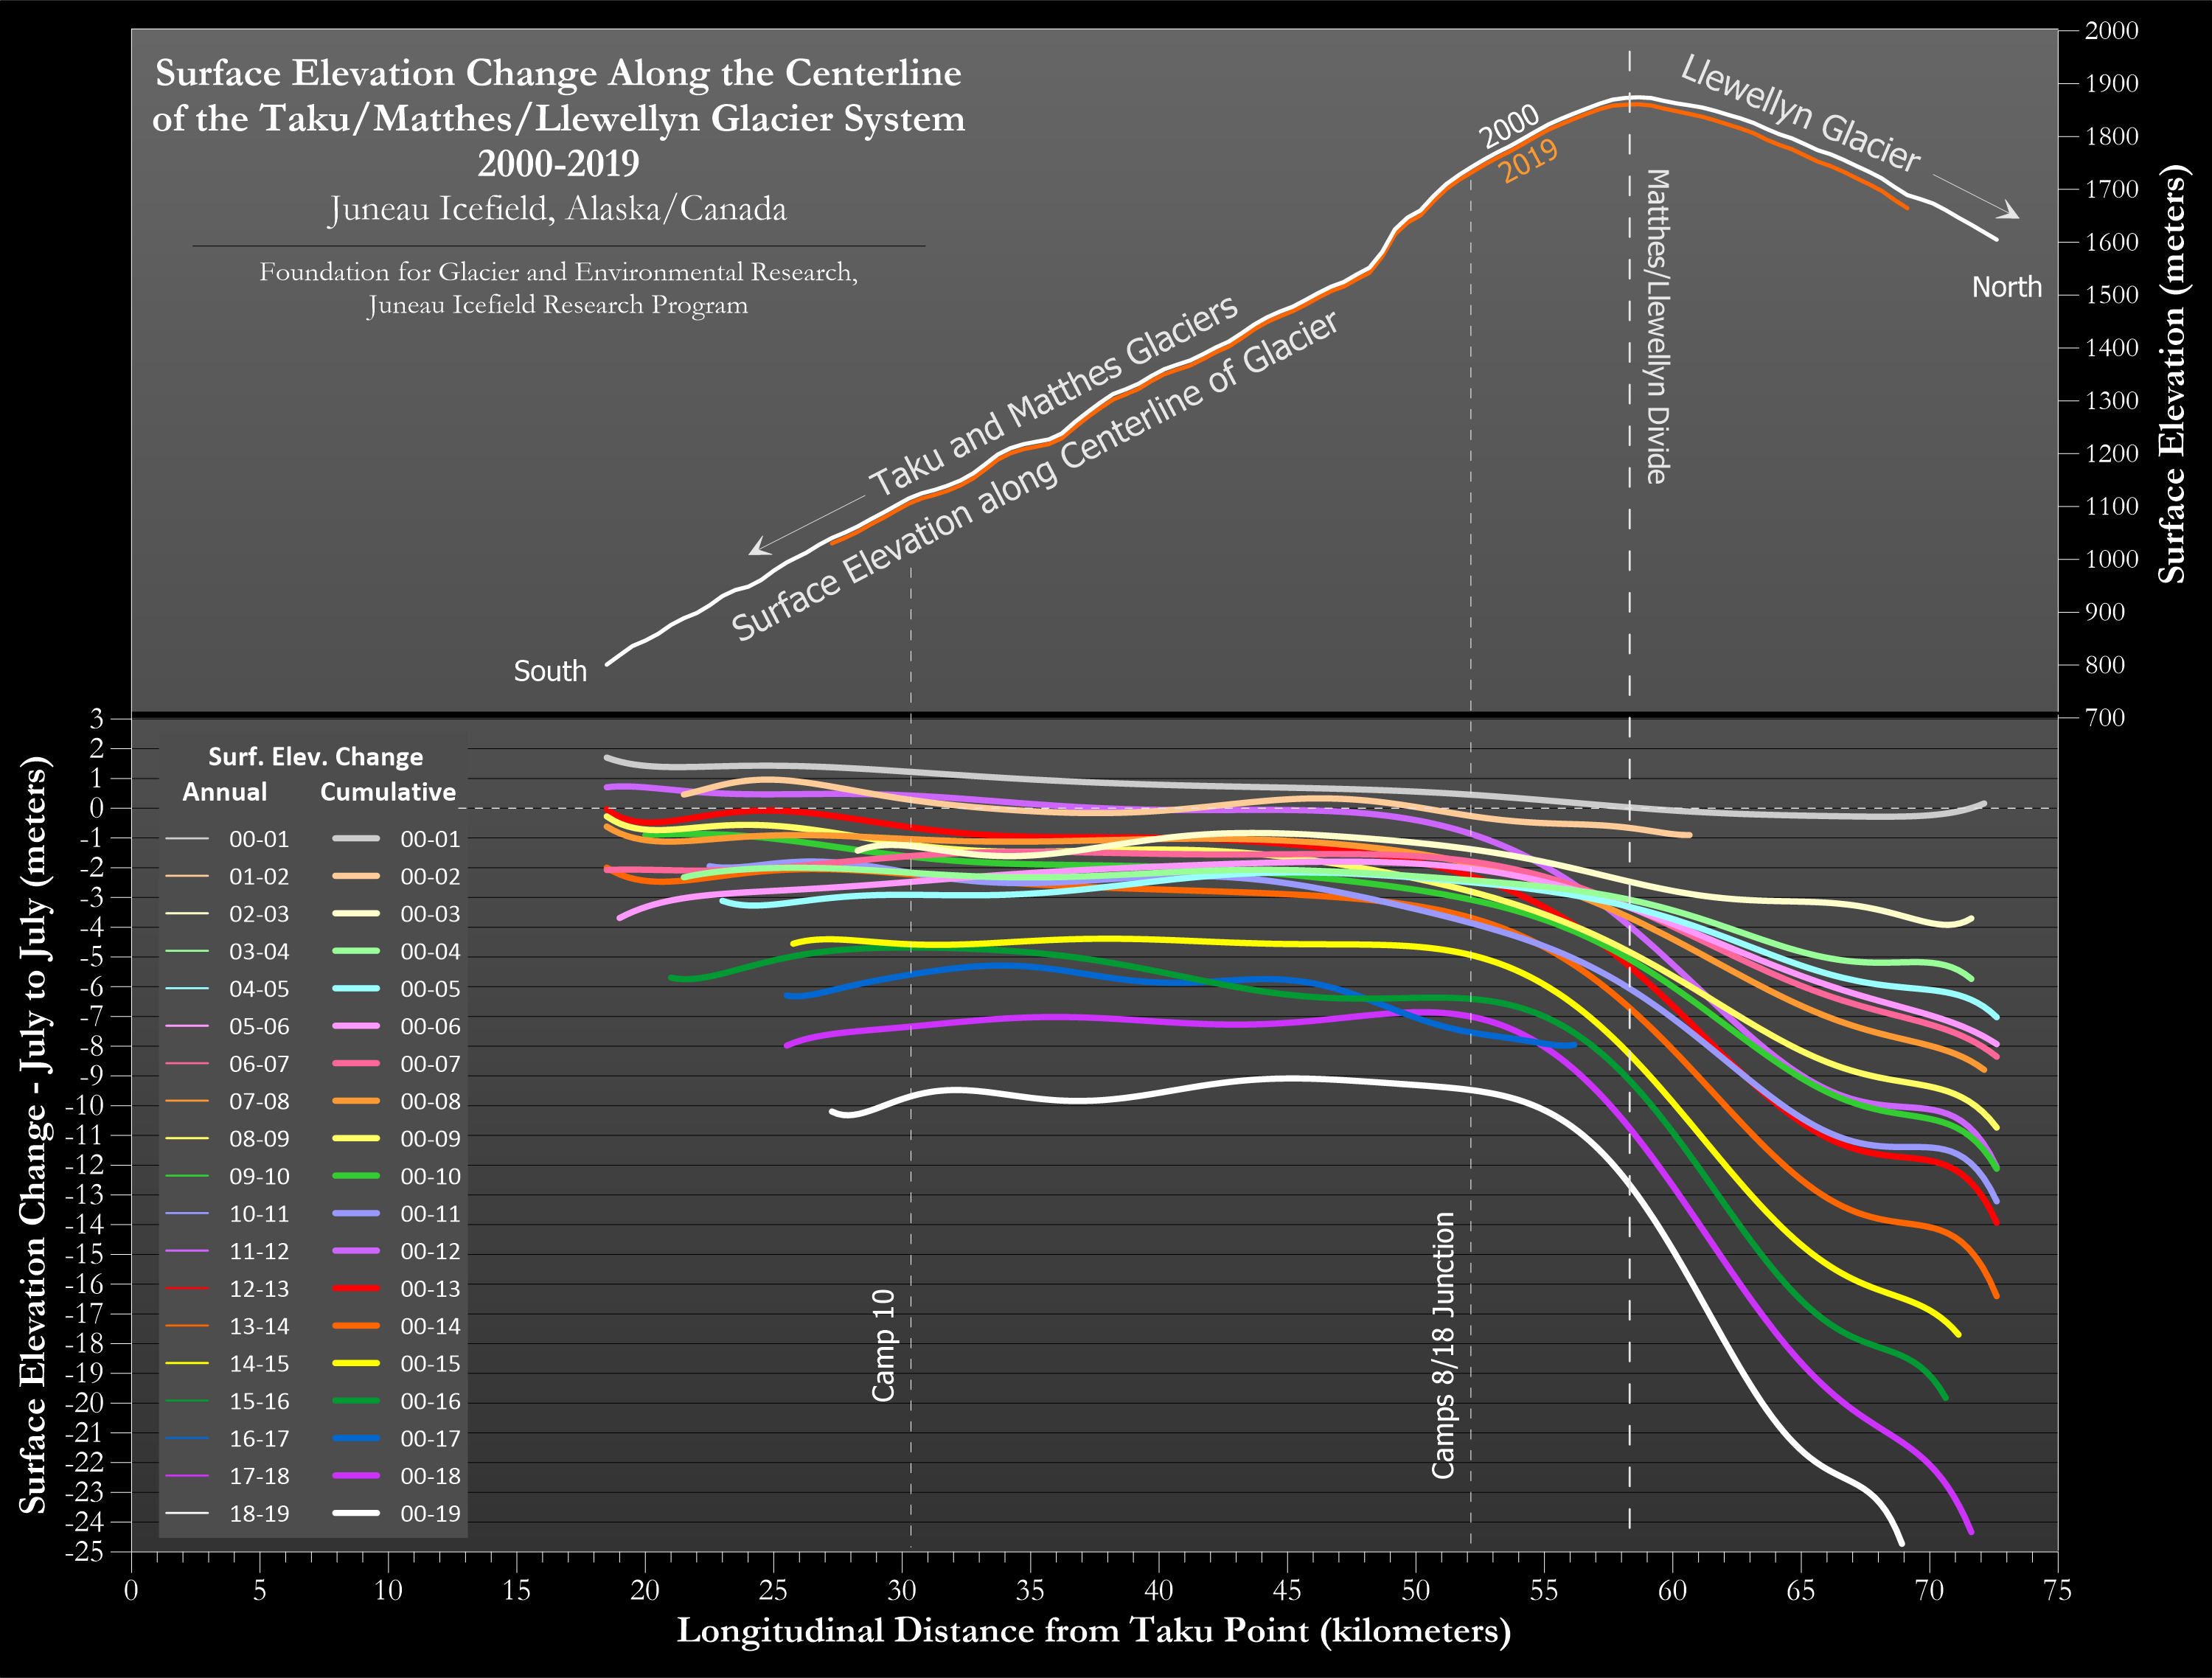
This is a static version of the animated graph above. This graph shows the individual annual (July to July) surface elevation change plots from 2000 to 2019. Throughout this time span, the range of year-to-year surface elevation change varied from 0 to -3 meters. The plots show a clear trend of decreasing surface elevation at the higher elevations, the Matthes/Llewllyn Divide, and down the Llewellyn Glacier.

Of particular interest is the 2011-2012 surface elevation plot, which shows a strong positive surface elevation increase over the entire length of the profile, including on the Llewellyn Glacier north of the Matthes/Llewellyn divide. This was the result the 2010-2012 La Nina event which resulted in the unusually snowy winter of 2011-2012. This, combined with a cool and cloudy 2012 spring and early summer which limited ablation, resulted in surface elevation increases of between 1 and 3 meters. This was by far the greatest year-to-year thickening which we have measured on the Juneau Icefield.

The graph below shows the cumulative surface elevation change from 2000 to 2019. This graph clearly shows the effect of decreasing surface elevation (and glacier thickness) at the higher elevations of the Taku/Matthes/Llewellyn system. Also of note, as evidenced by the 2000-2015 and later plots, is the increasing rate of surface elevation decrease (glacier thinning) over the entire length of the Longitudinal A profile since july 2014.

Longitudinal A Cumulative Height Change (2000-2019) 

Download the annual surface elevation change graph
Download the cumulative surface elevation graph


  Longitudinal A height change from 2000 to 2019  
         
   The graph shown above is similar to the graph at the top of this page. This graph shows only the cumulative surface elevation change from 2000 to 2019. It does not show the year-to-year changes. This version is better suited for printing.
Download this graph